-
Who we are


-
-
StrategyMission
To solve the challenges of organizations and communities through intelligent, secure, sustainable, and people-centered solutions, so they generate real value in their social and productive contexts.
VisionTo be the chosen company by organizations seeking to innovate with quality, purpose, and trust in the intelligent era.
Learn moreValues- Ethics and transparency
- Professionalism
- Respect
- Honesty
- Innovation
- Responsibility
- Effectiveness
- Integrity
- Customer orientation
- Punctuality
-
-
-
History
Sofis Solutions was born in 2005, in the city of Montevideo - Uruguay.
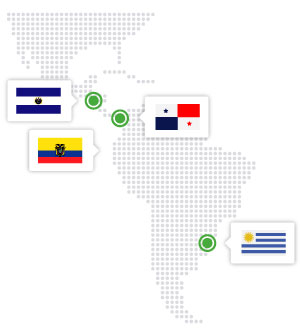
Since its inception, the main driver was and remains quality. This applies to processes, products, and relationships with the environment.The internationalization of the company It was one of the founding objectives. In the first stage, it expanded from Uruguay, and in the second stage, it opened offices in Latin American countries. Currently, it has offices in Montevideo, Panama, El Salvador and Ecuador.
-
-
-
Alliances


-
-
-
Certifications

CMMI-DEV-3
More information
National Quality Award - 2023 Edition
More information
ISO 9001:2015
Quality Management System
ISO 37001:2016
Anti-Bribery Management System
ISO 14001:2015
Environmental Management System
-
-
-
SustainabilityLearn more
Sofis Solutions integrates environmental, social, and governance (ESG) principles into its management and operations, driving sustainability through Digital Transformation. Its strategic approach prioritizes energy efficiency, digital inclusion, and transparency in digital governance, contributing to the responsible development of organizations.
-
-
-
What we do
-
-
IT projectsLearn moreAt our Software Factory, we specialize in providing software development solutions with a focus on excellence and sustainability.

-
-
-
Software qualityOur software quality services comprehensively address the aspects or dimensions of software quality, addressing this approach throughout the entire software development cycle.
- Manual and automated functional suitability testing
- Performance testing
- Software product quality
- Software quality consulting
Learn more
-
-
-
Staff AugmentationLearn moreWhat is IT Staff Augmentation? IT Staff Augmentation is a specialized technical staffing model that enables organizations to increase their agility and respond to the changing technological needs of the market.

-
-
-
ConsultancyIn the public sector, strategic decisions and projects with citizen-centered designs and excellence have the power to transform entire communities.Learn more

-
-
-
BIonA Suite


 BIonA Suite is a comprehensive platform for the intelligent management of processes and services in public and private organizations. BIonA Suite facilitates smart transformation with a focus on public value and user experience. Learn more
-
-
-
Projects
-
-
Recent projects
 FOCAL Regional StudyFOCAL - El Salvador
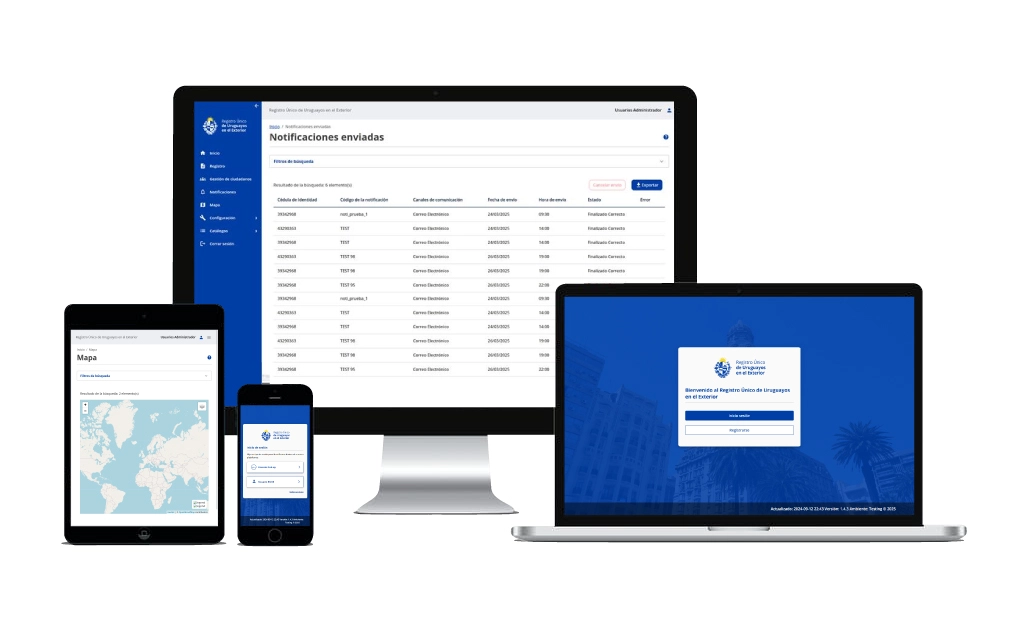 Single Registry of Uruguayans AbroadMinistry of Foreign Affairs - Uruguay
 Population and Housing Census 2023National Institute of Statistics - Uruguay
-
-
-
Digital Public InfrastructureWhat are Digital Public Platforms?ProjectsProducts
-
-
-
Sustainable Development


-
-
Mobile applicationsWe create hybrid, native, and PWA solutions for devices with Android and iOS operating systems.
Some of our projects:Digital Patrols, Ecuadorian Bovine Information System, Easy Budget UY, Digital Portfolio, SIGES Teachers App, SIGES Parents App.
Learn more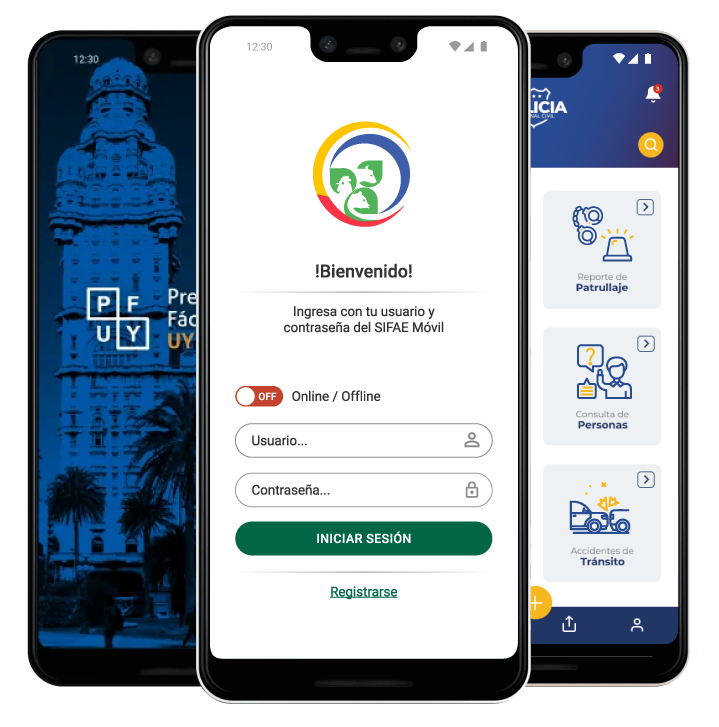
-
-
-
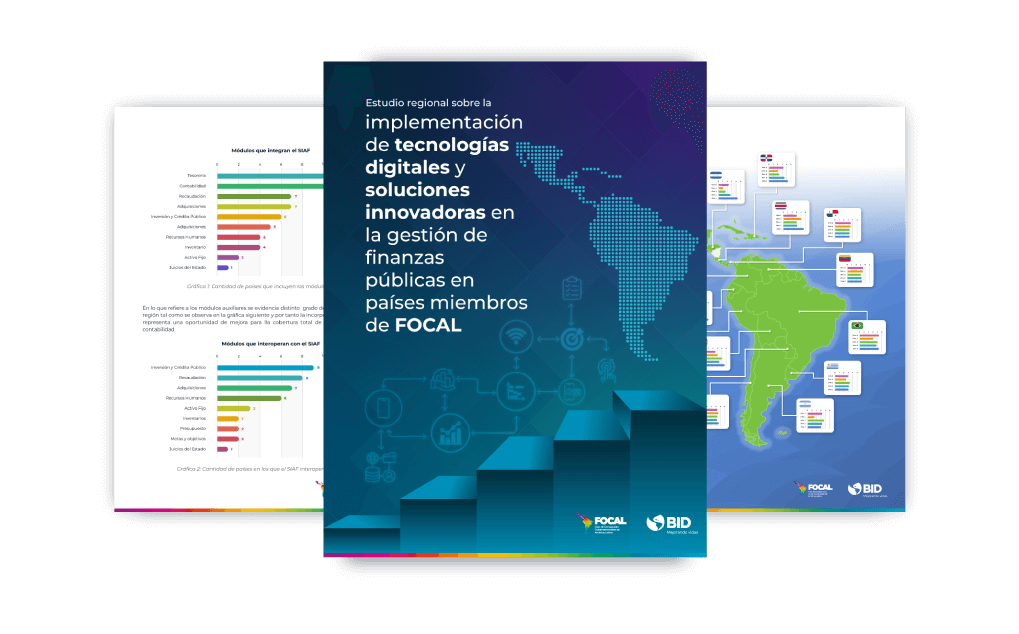
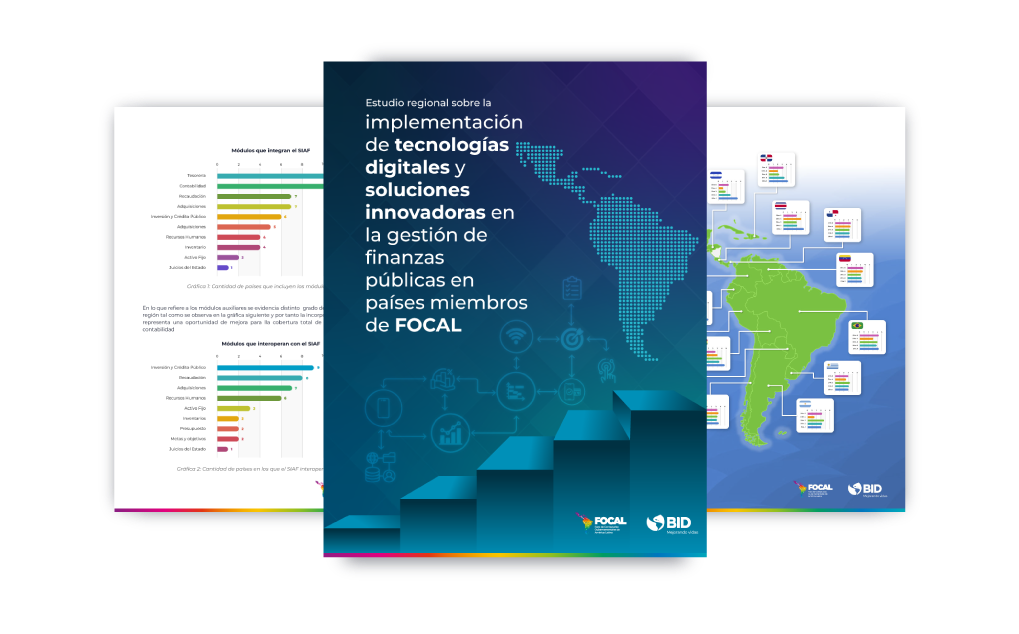
FOCAL regional studyThe purpose of the study was to carry out a regional analysis with the objective of identifying and evaluating the maturity level of the member countries of the Latin American Government Accounting Forum (FOCAL), currently composed of Argentina, Bolivia, Brazil, Chile, Colombia, Costa Rica, Ecuador, El Salvador, Guatemala, Honduras, Mexico, Nicaragua, Panama, Paraguay, Peru, Dominican Republic, Uruguay and Venezuela.Learn more
-
-
- AI
-
-
Artificial IntelligenceLearn moreAdvanced Artificial Intelligence (AI) and Big Data solutions that transform the way organizations make decisions and optimize their operations. We specialize in the development of intelligent autonomous agents and generative AI solutions using large language models (LLMs), both on local infrastructure and in the cloud.

-
- Press Room
-
-
Sustainable development
-
-
-
Interviews
 16/06/2025Virtual Threads in Java
-
- Innovation
-
-
#GreenSofisMore information
 Methodology
#GreenSofis Sustainable Digital Transformation Conference
 #GreenPath
-
-
-
AI For Everything
It is an initiative by Sofis Solutions, from the Intelligent Solutions Division, that promotes the adoption of artificial intelligence as a key driver of efficiency and effectiveness in the intelligent era.
It integrates both administrative and operational processes, promoting an organizational evolution where technology amplifies knowledge, optimizes decision-making, and generates value in a sustainable and inclusive way.
More information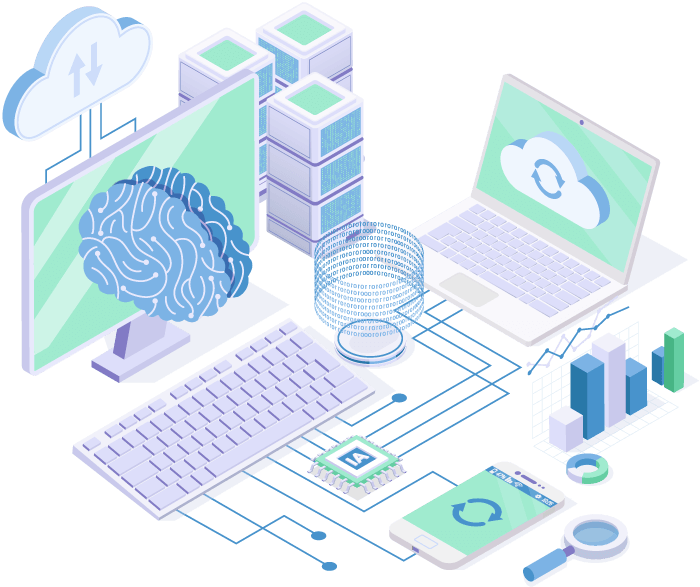
-
- Contact us
- ES PT-PT
-

 Digital Signature
 BionA Suite
 Biona SIgn


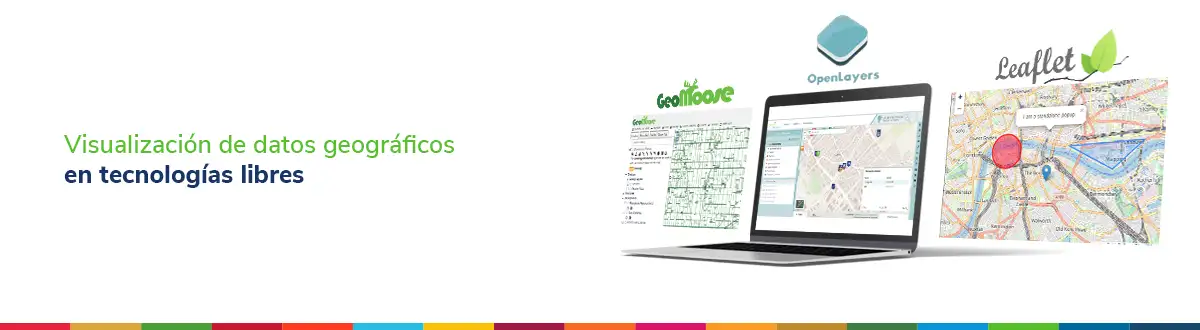
Geospatial Data Visualization with Open Technologies
Montevideo, March 24, 2023.
A Geographic Information System (GIS) is a valuable tool for managing a territory. Through its functionalities and features, it allows for analyzing and identifying relationships between spatial data aimed at solving territorial problems.
Nowadays, the vast majority of data handled has a spatial component, meaning it can be located on a map. Depending on the type of data being analyzed or the analysis desired, it can be visualized in a simple, precise, and interactive way, providing significant value for data-driven decision-making.
In this context, when discussing the digital publication of geospatial data, the question arises: How can this be done? To answer this, three Open Source libraries are presented, which allow the digital publication of geospatial data in a web application.
- GeoMoose: It is a framework written in JavaScript and HTML that allows quick map configuration, where layers can be selected (selection operations) and the usual web viewer tools can be configured. Some of these tools include: zoom buttons, measurement, printing, coordinates, and feature information, among others.
- OpenLayers: This is a more comprehensive JavaScript library with a long history in the field of geospatial information. Its functionalities allow adding layers and configuring common tools. The reference website is very detailed and contains examples of various configurations and tools offered.
- Leaflet: This is a lightweight, mobile-friendly alternative for presenting interactive maps on the web. Its functionalities include layer and tool configuration. Additionally, its website contains a plugin section created by the community, enabling the extension of the library’s full potential.
The presented alternatives are useful because they allow creating a basic web viewer quickly and easily. All three libraries can also connect to standard Open Geospatial Consortium (OGC) web services, such as Web Map Service (WMS) or Web Feature Service (WFS).
If more complex functionalities are needed, such as editing via WFS-T, the OpenLayers library can be chosen, as it would streamline implementation. For basic publication functionalities, Leaflet is a suitable option.
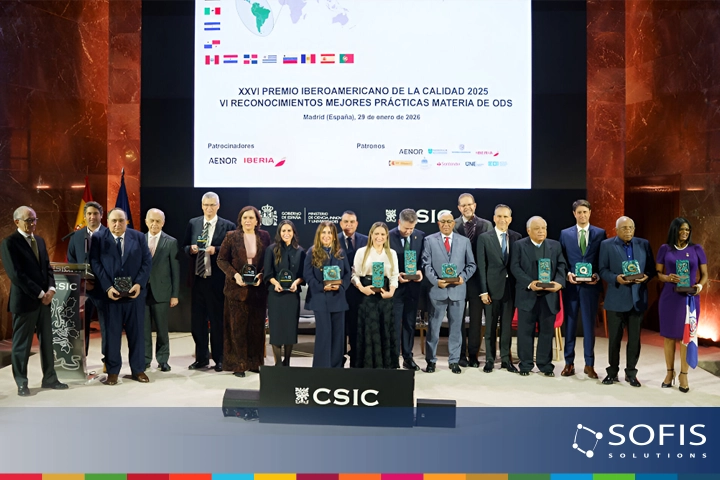
Madrid, January 29, 2026 – Sofis Solutions was honored with the Silver Award at the 2025 Ibero-American Quality Award, the highest recognition for exc......

In this interview we talked with the Software Engineering Group of Sofis Solutions, a team that has been actively working on the evolution of its deve...

On November 20th, the pilot edition of Creative Bureaucracy UY 2025 took place at the Sala Verdi, the local precursor to the Creative Bureaucracy Fest...